Take Home Exercise 01
Exploring Singapore’s Demographics
Create an age-sex pyramid to visualize Singapore’s demographic structure.
The Data
Singstat regularly releases its latest demographics data on its website. You may refer to this data for this task: Singapore Residents by Planning Area / Subzone, Age Group, Sex and Type of Dwelling, June 2022.
Step-by-Step Tableau Guide
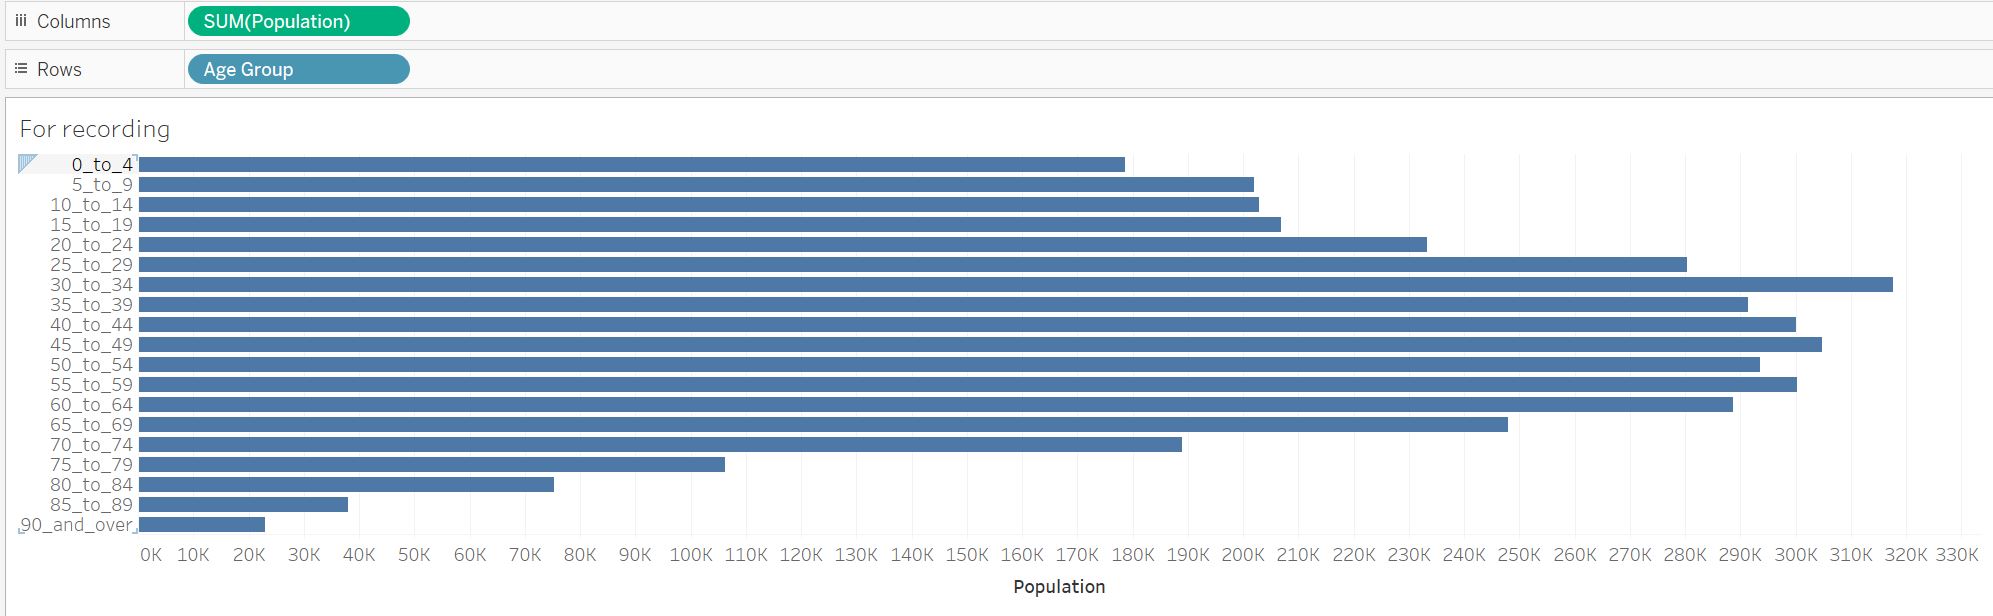
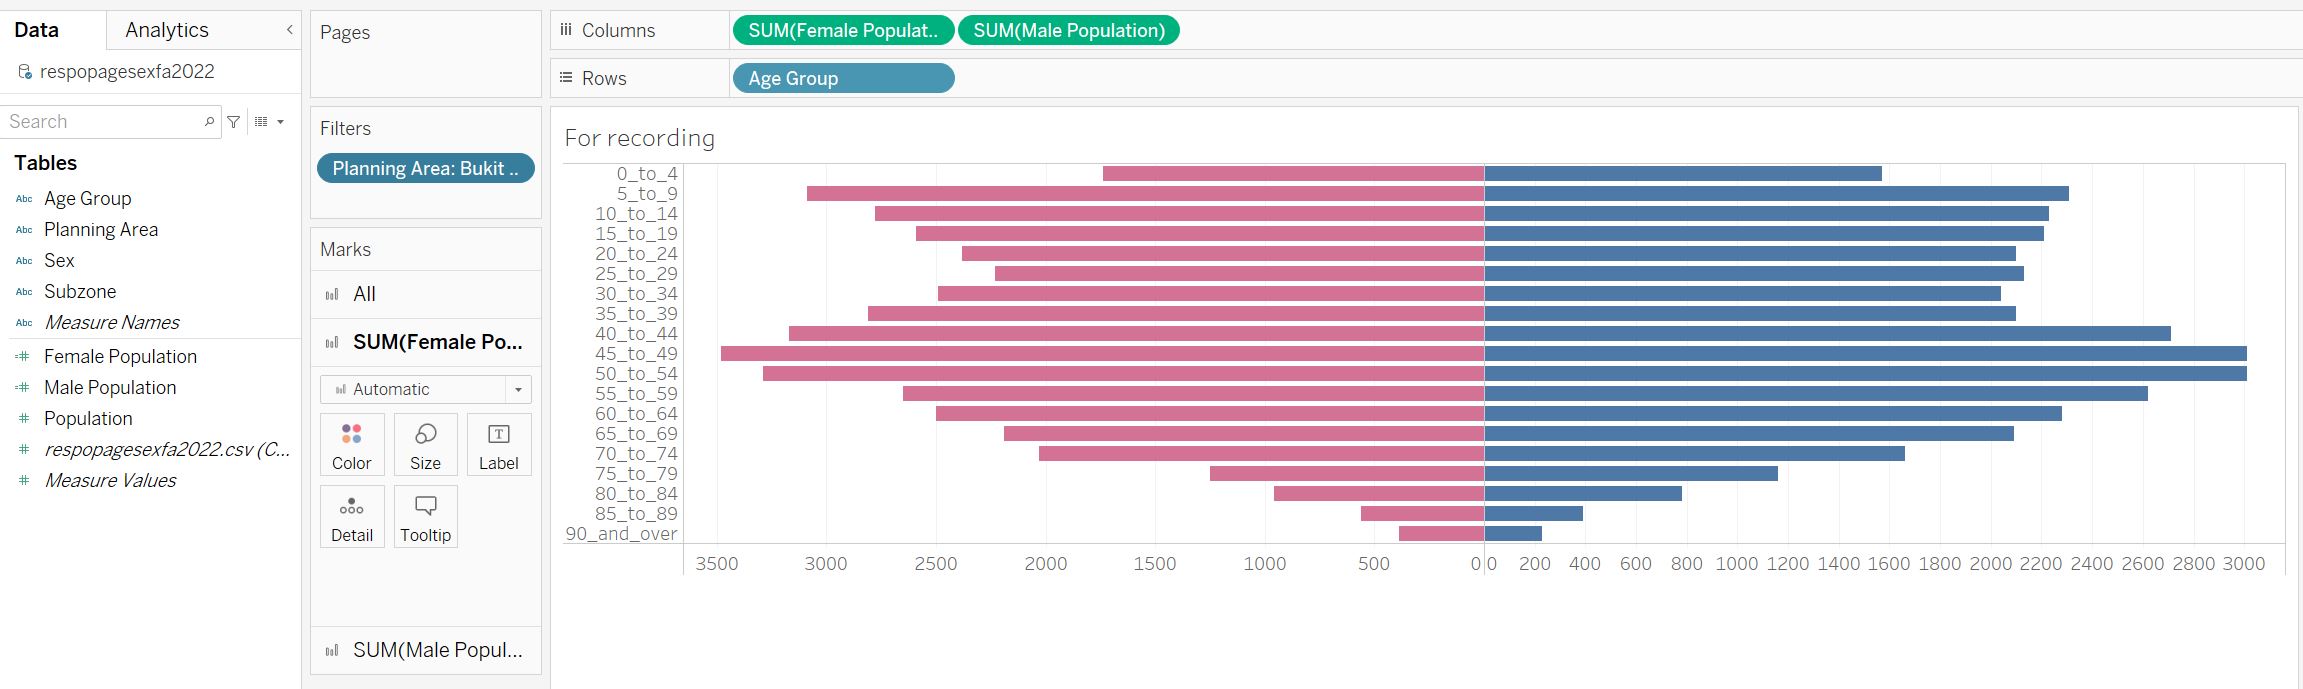
I explored the dataset by putting Population in Columns and Age group in Rows.
To create an age pyramid by sex, we need to divide population sum by female and male.
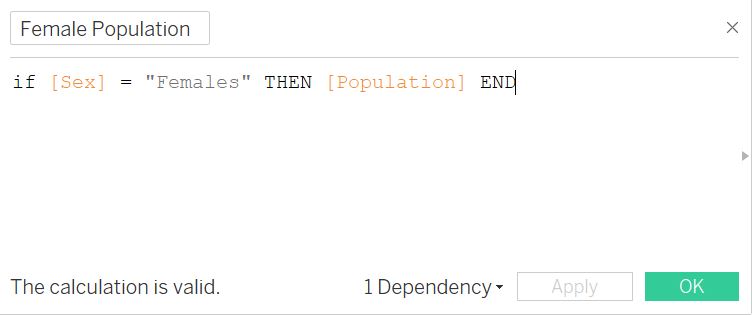
By using the default “Population” field, I edited the formula to contain only female population. To create male population field, simply duplicate the female population field and change the code with “Male”

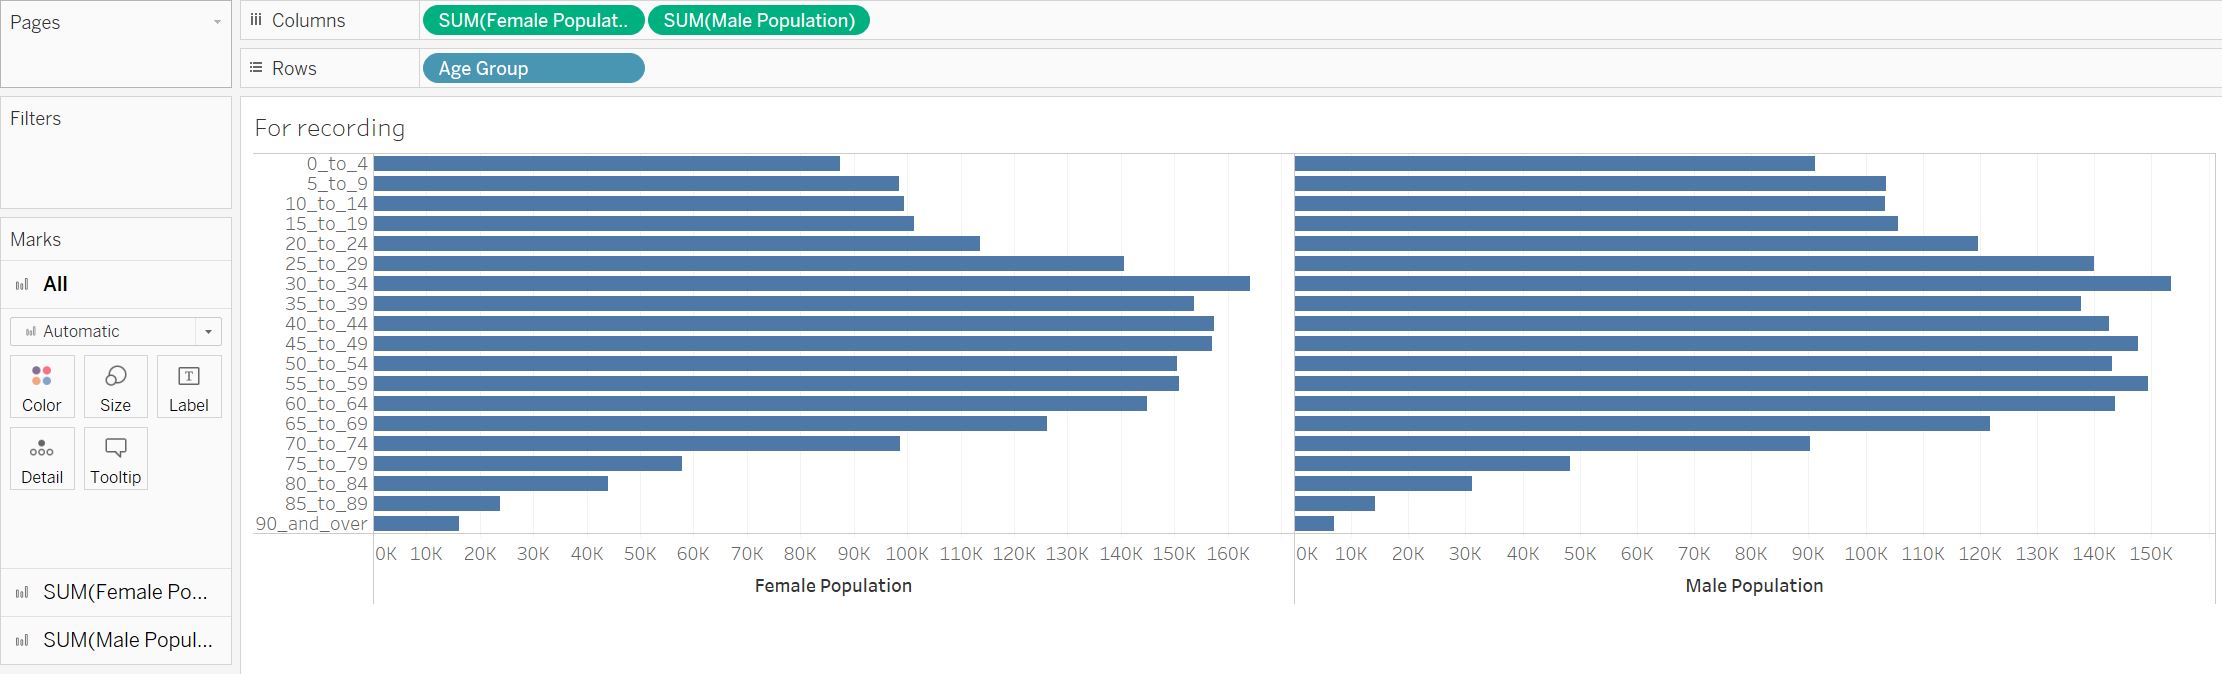
Now we have both female and population! Now, simply put these two fields under Column. How can we make this look like a pyramid?
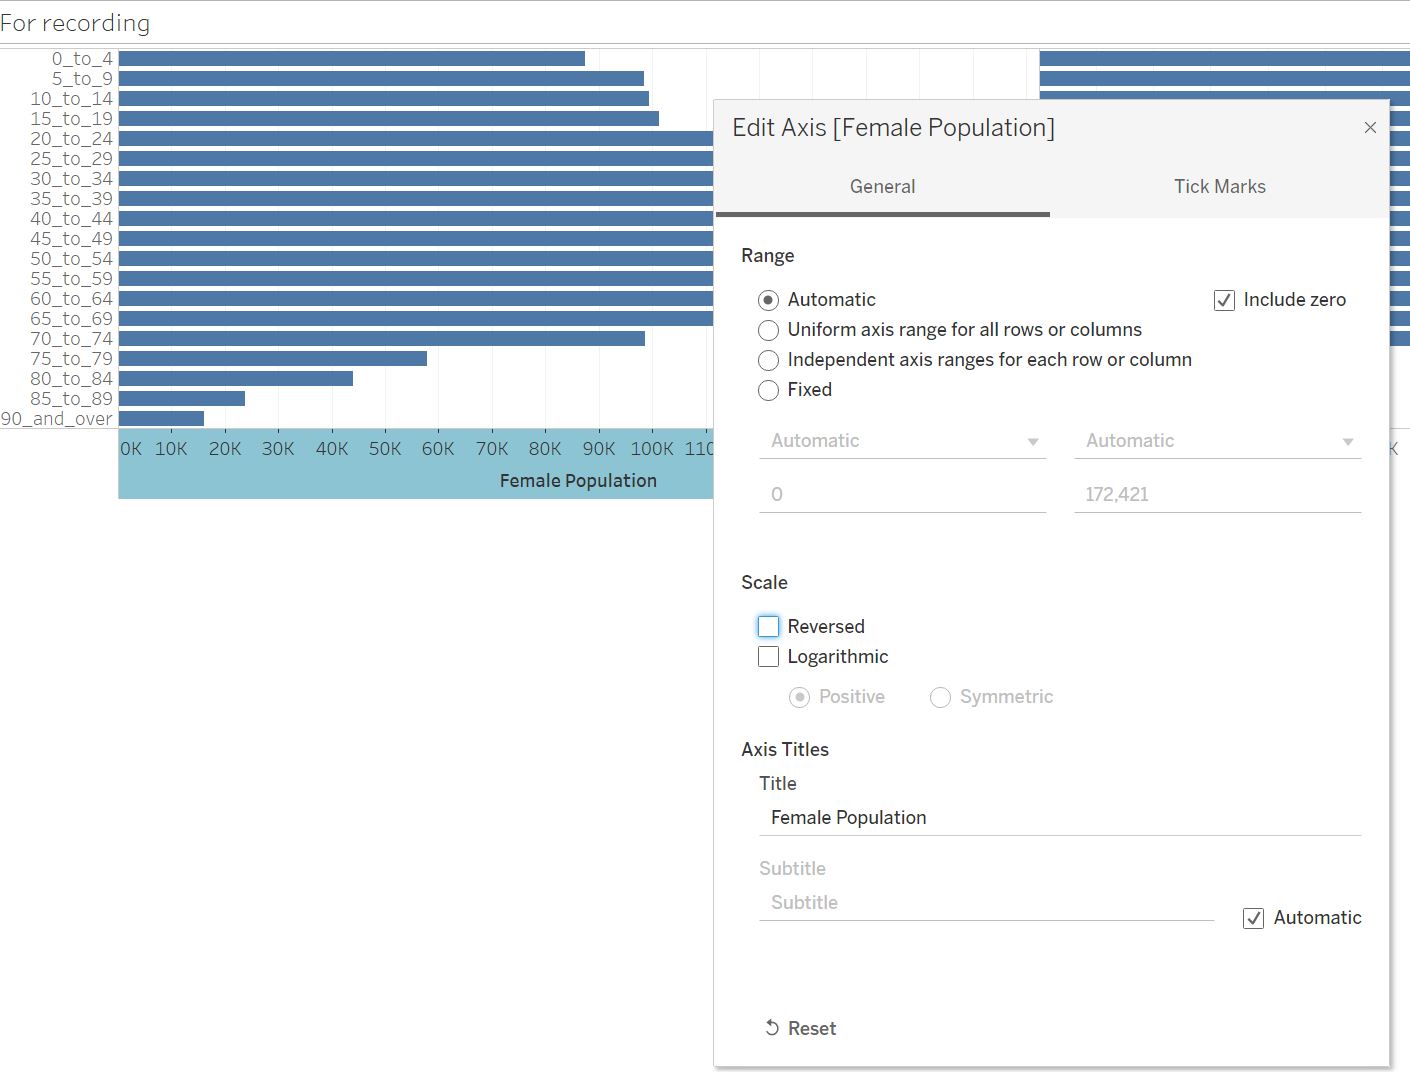
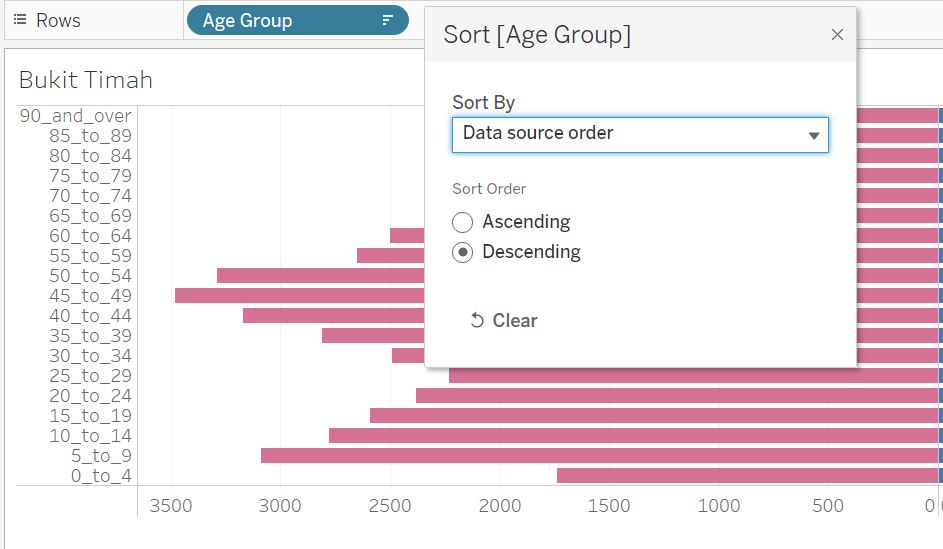
One way to do so is reverse the axis of female population chart. You can do it by right-clicking the chart and click on “reverse”.
Once you reverse the axis, color the chart to differentiate female and male chart. Go to Marks and click Color. To analyze age & sex distribution by different planning area, you may add a filter to select the area that you want to focus on.
Sort the label axis to a descending order, so that the older age group comes on top. You can do this by right-clicking Age Group, and adjust Sort Order option. Change the sheet name so that it matches your filtered planning area.
I chose 9 planning areas to be plotted in Trellis Chart to lay out different areas distribution in one view. Before we move on, I erased axis labels and adjusted header size to save some space in the dashboard. Then, I duplicated 8 more tabs, applied different planning area, and named them accordingly.

Tableau has a very useful function called Dashboard where you can put visualizations in different tabs in one sheet. Drag & drop planning areas in 3*3, make them fit the screen. Note that the bar chart does not indicate absolute number. You may bring mouse cursor over to the chart and read the exact value from the marker.
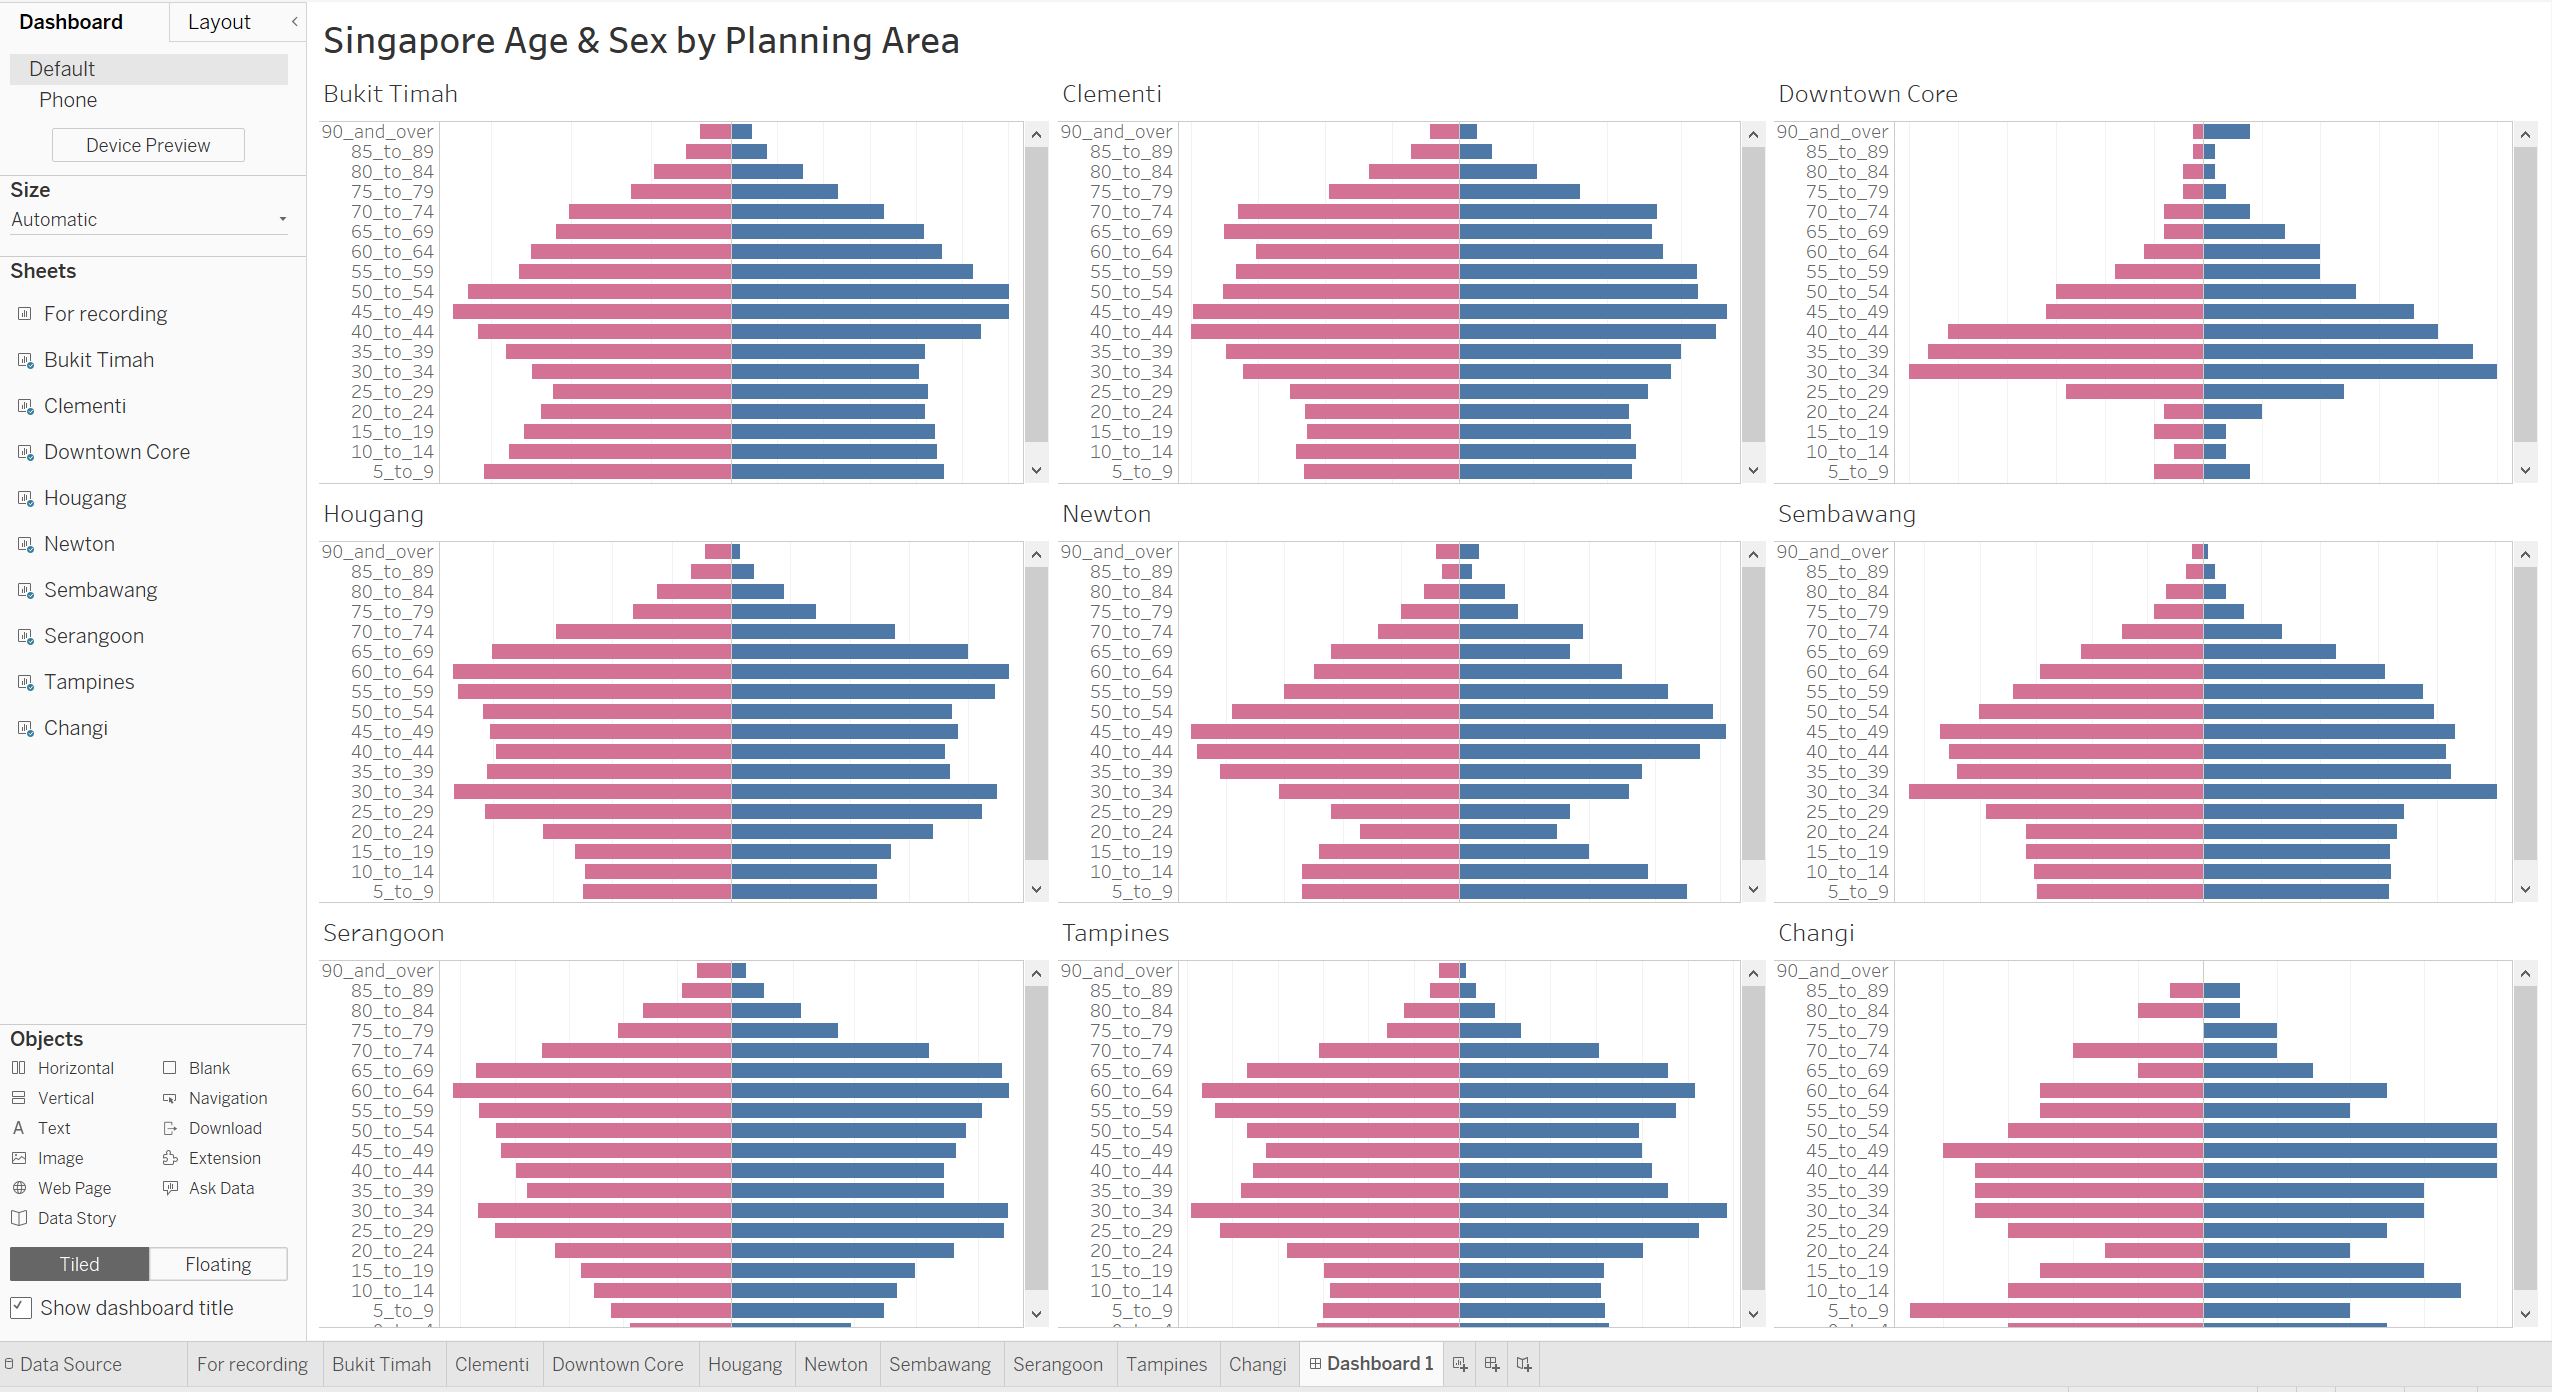
We have our age & sex pyramid in trellis chart, here are key findings -
Findings
Selected 9 areas can be grouped by similar sub-categories as per their location and geographic characteristics – Town (Downtown Core, Newton), West (Bukit Timah, Clementi), North-East (Serangoon, Hougang), East (Tampines, Changi), and North (Sembawang).
Downtown core has low elderly and kids’ group, instead has mostly 30~40s. Downtown core area has private residences targeting expats or high-income businesses. Therefore, the population pattern shows extremely low percentage of seniors and young kids. Population pattern shows that residents here are in their prime period of career path, which aligns with age group of 30~40s who could afford expensive rent. Among the rest of 8 planning areas, Newton shows the most similar pattern as Downtown Core. However, it has high percentage of middle age, and quite a lot of kids and teenagers. This pattern indicates that Newton has family-unit residents.
Bukit Timah and Clementi have similar population patterns with high portion of children and teenagers, as well as middle age. At the same time, they have quite a lot of 20s population as well. The pattern could be due to institutes near these planning areas, such as NUS, SIM, and polytechnics. Between Bukit Timah and Clementi, Clementi has more senior population, resulting in shorter bars for age groups below 20s.
Similarly, North-East area including Serangoon and Hougang has relatively higher distribution of senior population of age group above. 60. Together with Tampines, these areas have distinct pattern of “Star-shape.” There are distinctively standing out age groups with age interval of thirty years. For example, in Tampines, age group of 30 to 34 stands out, and similarly age group of 60 to 64 stands out. This may indicate that star-shape area may have bigger residences which could accommodate three generation families – grandparents, young parents, and their kids.
In Changi area, it is difficult to generalize the result of pattern as its absolute population is smaller than the rest of others, however, it still has unique pattern of higher population in middle age, could be the result of different gender distribution of logistics and aviation industry.
Suggestions
Business operators may choose Downtown Core area to target expats or high-income residents with premiums services, such as fitness centres, value-added service clinics, or luxury restaurants. Education centres may consider West area to improve learning facilities. West area could be a good option for private institutions targeting teenagers and young twenties. For North-East area, it would be a good choice to have more senior facilities. Moreover, in Tampines area, bigger apartments of more than 4 rooms would be ideal to accommodate big families.